
Figure 14. ONGC wells studied in the Krishna-Godavari Basin near the Bay of Bengal. Samples were obtained from the core library in Rajahmundry.
The Krishna-Godavari Basin expands from Rajahmundry seaward to the Bay of Bengal. In this basin the lava flows are buried under 2000 m to 4000 m of sediments marking rapid subsidence. Drilling by the Oil and Natural Gas Corporation of India has recovered numerous cores from this area and twelve wells have been studied to evaluate the KTB and its relationship to Deccan volcanism (Fig. 14). The wells were sampled at the Rajahmundry core library.
Stratigraphy of Krishna-Godavari Basin Deccan mega-flows
The Krishna-Godavari (K-G) Basin wells were analyzed based on lithology, total Gamma and Resistivity data, as well as biostratigraphy. Wells for this study were taken from middle shelf environments that cut through the distal end-members of the Tirupati sandstone, Razole Formation and Palakollu shale (see Keller et al., 2011, JGSI for details), as well as from deeper shelf environments dominated by shales. In most of the wells, the Razole Formation consists of up to eight and occasionally nine Deccan mega-flows separated by intertrappeans. Three to four and occasionally five mega-flows are located below the KTB and mark Deccan phase-2 another three to four mega-flows mark Deccan phase-3 in the early Danian (Jaiprakash et al., 1993; Raju et al., 1994, 1995, 1996; Misra, 2005; Raju, 2008; Jay and Widdowson, 2008) (Fig. 15).
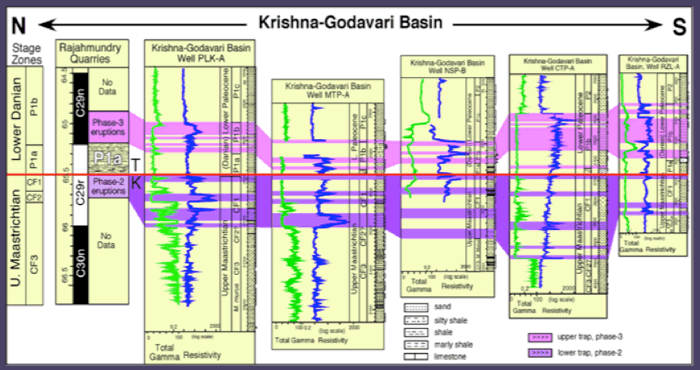
Figure 15. Wells in the Krishna-Godavari Basin contain 4-5 megaflows in phase-2 and 3-4 in phase-3. They can be correlated from well to well based on total gamma and resistivity data. in contrast, the mega-flows of phase-2 and phase-3 in the Rajahmundry quarries cannot be easily separated because they lack intertrappean sediments. From Keller et al., 2011.
Correlation of lava flows in the K-G Basin wells is based on Resistivity and Gamma values as shown in Fig. 15. Resistivity values for normal sandstones, siltstones and shales vary between 1-6 qm, unless they are hydrocarbon bearing. In contrast, resistivity values for the basalts vary anywhere from 50 qm to > 200 qm depending on the degree of sediments incorporated as a result of erosion at the base and top. In all wells, e – logs show high to very high resistivity peaks against the basalt flows. Most basalts are seen as a distinct resistivity peak on the logs, whereas some basalts are less distinct due to mixed basalt and sediments. Gamma logs show significantly lower values in basalt flows relative to the intertrappean clastic sediments (Fig. 15). The cores and drill cuttings from these mega-flows are dark grey to greenish grey in color, very hard and compact.
Correlation between individual lava flows of the Rajahmundry quarries and the Krishna-Godavari (K-G) Basin is not possible because in Rajahmundry the lava flows of Phase-2 and Phase-3 are fused or separated only by thin paleosoil or red bole layers (Fig. 7). In contrast, in the K-G basin four lava flows are clearly separated by intertrappean sediments in each volcanic Phase-2 and Phase-3. This demonstrates that Deccan volcanism during Phase-2 and Phase-3 occurred in rapid pulses with mega-eruptions flowing 1500 km across India and out into the Gulf of Bengal.
Deccan mega-flows in the K-G Basin are generally 5 m to 15 m thick, except for two wells where the lava flows in phase-3 are 60 m thick. The variation in the number of basalt flows and variable thicknesses can be explained by topography and erosion. The variable thickness of intertrappeans is a function of topography, subsidence and influx of sediments eroded from shallower areas, as indicated by an abundance of sand in some wells (Fig. 15, Keller et al., 2011, JGSI). The overall pattern of the mega-flows in each volcanic phase is consistent with sheet flows of very large volume pahoehoe flow fields (Self et al., 2008).