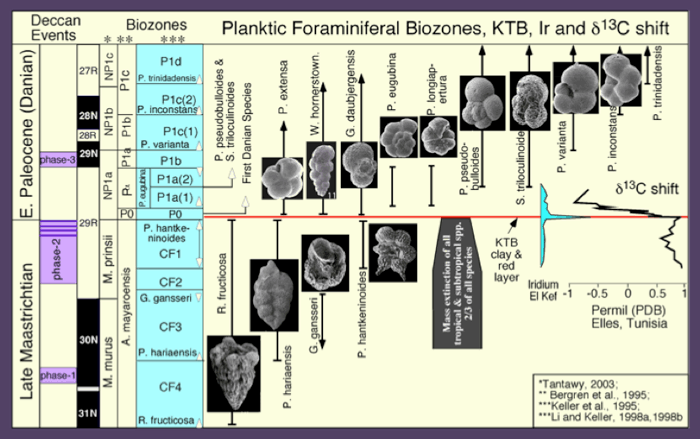
Figure 16. Biostratigraphy and planktic foraminiferal zonal scheme by Keller et al. (1995, 2002) and Li and Keller (1998a,b) for the late Maastrichtian and early Danian in the El Kef stratotype section and point (GSSP) with illustrations of index species, the Ir anomaly (Rocchia et al., 1996) and d13C shift (Keller and Lindinger, l989) are correlated with the paleomagnetic time scale and Deccan volcanic events. The nannofossil zonal scheme (*) by Tantawy (2003), and the planktic foraminiferal zonation (**) by Bergren et al. (1995) are shown for comparison.
AGE: Global Biozonation Scheme
The high-resolution planktic foraminiferal biostratigraphic zonal scheme developed by Keller et al. (1995, 2002) for the Danian and by Li and Keller (1998a,b) for the Maastrichtian is applied in the K-G Basin wells. The KTB can be globally identified based on a number of criteria: the mass extinction of planktic foraminifera, the evolution of the first Danian species within a few centimeters above the extinction horizon, a clay layer with a millimeter thin oxidized red layer at the base, an iridium anomaly in the red layer, and a 2 to 3 permil d13C shift across the clay layer (Keller et al., l995; Cowie et al., 1989; Remane et al., 1999).
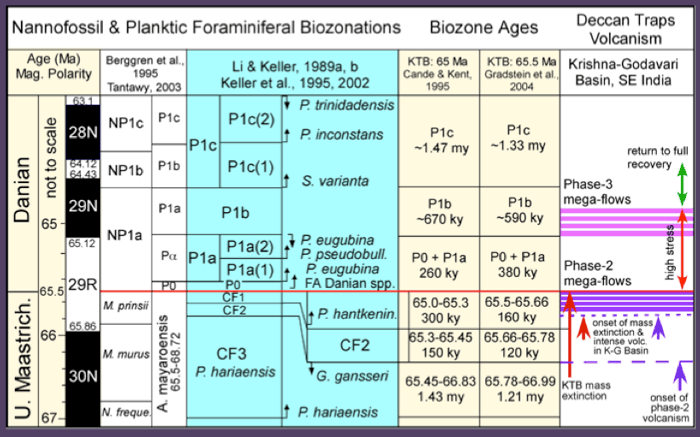
Figure 17. Late Maastrichtian and early Danian planktic foraminiferal zonal schemes and ages of biozones based on two time scales with the KT boundary at 65.0 and 65.5 Ma. Also shown for comparison are the zonal schemes of Caron (1985), Berggren et al. (1995) and the nannofossil zonation of Tantawy (2003). CF=Cretaceous Foraminifera. From Keller et al., 2011.
Figure 17 shows ages for biozones calculated for the time scales of Cande and Kent (1995; KTB at 65 Ma) and Gradstein et al. (2004; KTB at 65.5 Ma). Ages referred to in this website are based on the KTB at 65.5 Ma, however, new radiometric dating suggests that a 66Ma age may be more accurate.
Mass Extinction linked to Deccan Volcanism: K-G Basin
In the Krishna-Godavari Basin, about 75 km seaward from Rajahmundry, sediment deposition occurred in a shallow middle neritic environment (<100 m) that deepened seaward (~100-150 m) (Raju et al., 1994; Keller et al., 2008). Upper Maastrichtian planktic foraminiferal assemblages below the phase-2 mega-flows average between 20 and 30 species (e.g., PLK-A, NSP-A, NSP-B, ELM-A, RZL-A; Fig. 18), which is typical diversity in middle neritic environments (Keller and Abramovich, 2009). In general, the most diverse assemblages were observed in the cored intervals, such as shown for PLK-A and NSP-A wells (Figs. 18-19). Since the cored intervals contain the most reliable data, the lower diversity in core cuttings is likely an artifact of preservation and culling of species suspected to be down-core contaminants. In wells with predominantly sand and silt deposition foraminifera are rare due to increased dissolution and dilution by high sediment influx. Biostratigraphic control in these wells is more difficult to establish. From Keller et al., 2011.
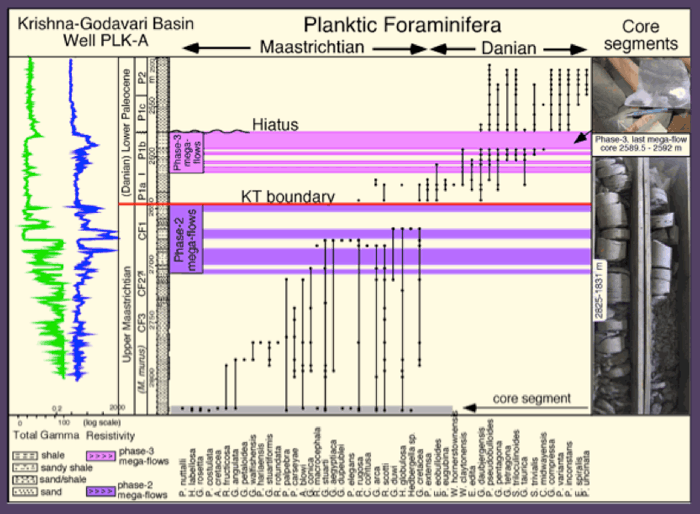
Figure 18. ONGC well PLK-A with biostratigraphy, species occurrences, phase-2 and phase-3 mega-flows plotted against lithostratigraphy and e-logs (gamma and resistivity). Core segment shown is from the base of the section, and another core segment from the last mega-flow in phase-3. From Keller et al., 2011.
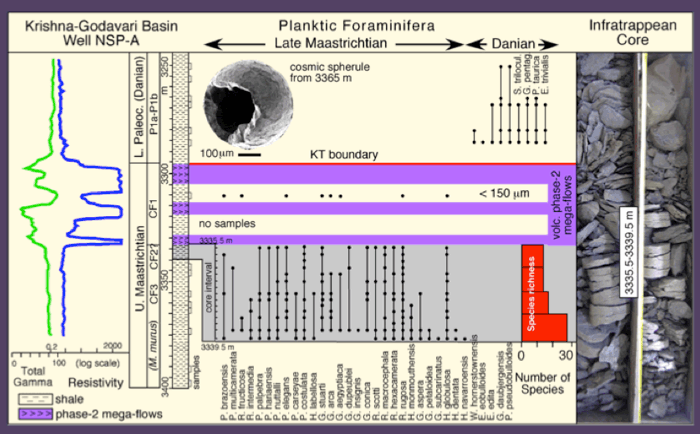
Figure 19. ONGC well NSP-A with biostratigraphy, species occurrences, and phase-2 mega-flows plotted against lithostratigraphy and e-logs (gamma and resistivity). From Keller et al., 2011.
In ten out of eleven wells analyzed, late Maastrichtian faunal assemblages below phase-2 mega-flows are typical of zones CF2-CF3. In the absence of Gansserina gansseri these two zones cannot be differentiated. Zone CF2 spans 120 ky (65.66-65.78 Ma) and zone CF3 spans 1.21 my (65.78 to 66.99 Ma, time scale of Gradstein et al., 2004; Fig. 6). Zone CF3 is nearly equivalent to the Micula murus nannofossil zone. Saxena & Misra (1994, 1995) and von Salis and Saxena (1998) identified the M. murus zone assemblage below phase-2 mega-flows in the RZL-A, NSP-B and PLK-A wells (Figs. 18-19). From Keller et al., 2011.
In well NSP-A, a 4 m cored interval below the first mega-flow of phase-2 records a 50% diversity crash (Fig. 19), which appears to be related to the onset of Deccan phase-2 volcanism, except that no lava flows arrived in the Krishna-Godavari (K-G) Basin at this time. After this extinction phase, the first of the longest lava flows on Earth reached the K-G Basin. No samples are available from the first intertrappean of this well, but in other wells there is another 50% crash after the first mega-flow (discussed below; Keller et al., 2011, JGSI). A cosmic spherule was found at 3365 m, though the significance of this is uncertain.
Sediments between the lava mega-flows in the Krishna-Godavari Basin yield information on the nature of environmental stress and the KTB mass extinction. The pattern of four and sometimes five mega-flow eruptions repeats itself in most wells of the Krishna-Godavari Basin in phase-2 and three to four mega-flow eruptions are present in phase-3 (Figs. 18, 20). These are the longest lava flows, known on Earth spanning 1500 km across India and out into the Bay of Bengal (Fig. 6). In all ONGC deep wells examined, the lava flows are separated by sediments, which indicate the elapsed time between flows (Fig. 16, 18, 19). Foraminifera are present in these intervals but of very low diversity and abundance. For this reason a composite dataset of nine wells was used to gain a representative sampling of the extinction pattern in Deccan volcanism phase-2 and phase-3 (Fig. 20).
Estimates of the duration of major flow eruptions (based on red boles between eruptions elsewhere in the Deccan Volcanic province (DVP)) suggest very short time spans for the eruption itself as well as between lava flows. Chenet et al. (2007, 2008) estimated that each major flow eruption occurred over weeks to months and at most a few years and that the entire phase-2 volcanism erupted over as little as a few tens of thousands of years (Courtillot, pers. communication). At this fast rate, the mass extinction may not be resolvable in the more condensed marine record compared with the high sedimentation rate of the K-G Basin. To solve this conundrum, U-Pb age dates are needed of individual lava flows. From Keller et al., 2011.
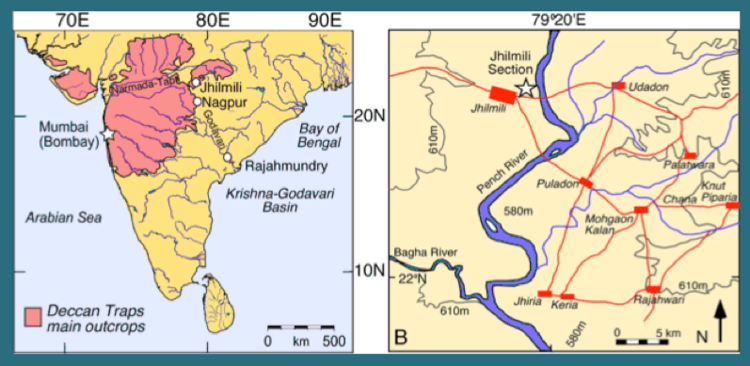
Figure 21. Location of Jhilmili and the Jhilmili secton. From Keller et al., 2009a.
Figure 20. Composite species ranges of nine wells in the Krishna-Godavari Basin plotted against biostratigraphy and phase-2 and phase-3 lava flows of the PLK-A well. Cored intervals at the base of the section, below the first phase-2 mega-flow and below the last mega-flow of phase-3 record the most reliable species richness data. A maximum of 28 species in the upper Maastrichtian is typical for middle neritic environments (~100 m depth). Note the mass extinction began with the onset of phase-2 volcanism (50% drop in species richness), with another 50% drop after the first lava flow, and was complete by the last mega-flow at or near the KTB. From Keller et al., 2011.
Extinctions pattern
Pre-KTB extinctions: In well NSP-A, the first meter of the 4 m cored interval below Phase-2 mega-flow eruptions contains a diverse late Maastrichtian assemblage that is typical of middle neritic environments (Fig. 19, Keller and Abramovich, 2009). But in the upper 3 m species richness decreases gradually by 50% leaving just 13 species. This species reduction primarily affected the large ornate and specialized species. Previous records have shown that on a global basis many large ornate and specialized species gradually disappeared in zone CF1 prior to the KTB mass extinction (review in Keller, 2001). This dramatic diversity decrease appears to be linked to the onset of phase-2 Deccan eruptions, which did not yet produce mega-flows into the K-G Basin. Nevertheless, the biologic effects on marine organisms were severe leading to 50% extinctions in planktic foraminifera. Whether these extinctions are precisely coeval with the global gradual extinction pattern in zone CF1 is still uncertain because the precise age of the cored interval in NSP-A is still uncertain.
In well NSP-A just 13 species are present prior to the first mega-flow. Unfortunately, no samples are available from the first intertrappean of phase-2, but a composite of nine wells in the area yields just 7 survivor species (Fig. 20). This suggests a nearly 50% reduction after the first mega-flow eruption. Survivors are ecologically resistant species, dwarfed and show signs of dissolution (ocean acidification). No recovery occurred between mega-flow eruptions. In the second and third intertrappeans, just 8 and 6 species remain, respectively, and after the fourth and last mega-eruption of Phase-2 the mass extinction is complete. The fact that there is no recovery in between the mega-eruptions indicates that they followed each other in rapid succession and may have caused a run-away effect leading to the KTB mass extinction.
The global effects Deccan volcanism leading up to the KTB mass extinction are now being investigated based on high-stress faunas from India leading westward through the eastern Tethys, the NW Atlantic, Caribbean, Gulf of Mexico and Western Interior Seaway (Texas).
KTB to earliest Danian (zone P1a): In eleven K-G Basin wells analyzed to date, the intertrappean above the phase-2 mega-flows contains the earliest Danian zone P1a assemblage (Fig. 20) and occasionally rare reworked Cretaceous species consistent with previous observations in Rajahmundry quarries (Keller et al., 2008; Malarkodi et al., 2010). This demonstrates that the mass extinction of Cretaceous species was coeval with Deccan volcanic phase-2, suggesting a cause-and-effect relationship. To date no deep cores are available that recovered the KTB clay layer above phase-2 eruptions. However, this interval has been recovered at the Um Sohrynkew section of Meghalaya where a the KTB red layer and clay is present (Gertsch et al., 2011).
The largest intertrappean interval is between Deccan volcanism phase-2 and phase-3, a time interval that spans C29r above the KTB, or about 380,000 years. No volcanic flows reached Rajahmundry during this time. Evolution of Danian species in this intertrappean follows the same pattern as observed globally, although first appearances of some species may differ due to poor preservation or large sample spacing (Figs. 18, 19, 20). All evolving early Danian species are very small (< 100 mm and frequently < 63 mm), with simple chamber arrangements and unornamented morphologies that reflect adaption for survival in highly stressed environments (e.g., Keller and Pardo, 2004; Pardo and Keller, 2008). The fact that these assemblages mirror the global evolutionary pattern demonstrates that environmental conditions after the main phase-2 of Deccan volcanism remained stressed in India and globally. From Keller et al., 2011, 2012.
On a global basis this is a time of continued high stress conditions, when evolutionary developments are restricted to small primitive morphotypes with thin shells and unornamented chambers. Guembelitria blooms dominate, but alternate with other more short-lived ecological opportunists such as Parvularugoglobigerina eugubina, Globoconusa daubjergensis and small Danian biserial species (Pardo and Keller, 2008; Keller and Abramovich, 2009). This prolonged interval of high stress can’t be due to the KTB catastrophe, but rather indicates continued stress inducing conditions during the early Danian, such as intermittent volcanism blasting away or high rates of weathering in the Deccan Volcanic Province creating toxic waters. This puzzle requires further studies.
Deccan Volcanism Phase-3 (zone P1b, C29n)
Faunal assemblages in phase-3 intertrappeans are similar to zone P1a, except for the disappearance of P. eugubina and P. longiapertura, the decreased abundance of early zone P1a species (e.g., Parvularugoglobigerina extensa, Eoglobigerina edita, Woodringina claytonensis, W. hornerstownensis, E. eobulloides), and increased abundance of other species (Figs. 18, 19, 20). Species sizes remained small, with morphologies generally < 150 mm, as also observed globally (Keller, 1988; 1989; Luciani, 2002; Coccioni and Luciani, 2006; Keller et al., 2007a, b, 2009e). No major differences are observed between faunal assemblages of the three intertrappeans, which suggests that environmental conditions remained tolerable during volcanic phase-3. Alternatively, since these early Danian species evolved during high-stress conditions, they were primed for survival, unlike most species in the late Maastrichtian, which were highly specialized and adapted for narrow ecological niches (Abramovich et al., 2003; Keller and Abramovich, 2009).
Although there is no mass extinction associated with Phase-3 mega-eruptions, high stress conditions prevailed as indicated by the long delayed marine biotic recovery, the low diversity and dwarfed species. Full marine recovery occurs only after phase-3 volcanism ended and not just in India, but on a global basis (Pardo and Keller, 2008; Keller and Abramovich, 2009). Moreover, only after Deccan phase-3 is there a return to normal larger sized species and increased diversity. This strongly suggests that Deccan volcanism played critical roles in both the KTB mass extinction and the delayed marine biotic recovery that has been an enigma for so long.

